Vattenfall — Creating value from data; improving the service experience.

Vattenfall is one of Europe’s largest producers and retailer of electricity and heat. In 2019, Vattenfall took further steps to unite its brand by changing the online presence of its Dutch subsidiary Nuon to Vattenfall, optimizing their business-to-business service along the way.
The brief
The customer effort score is an important KPI for Vattenfall.
Investing heavily in offering a user-friendly online self-service platform for Dutch business-to-business customers,
Vattenfall asked me to help distil available data into well-designed visualisations during their Nuon to Vattenfall transformation.
Painting a picture with available data
Data leaves assumptions behind and provides us with facts. Over the years I became comfortable working with data as big as it comes. However, answering the fundamental question “what to design” is somewhat difficult with quantitative data alone.
Up for the challenge, considering the scope and being part of an agile working development team, I decided to approach each 'user story' with the same process;

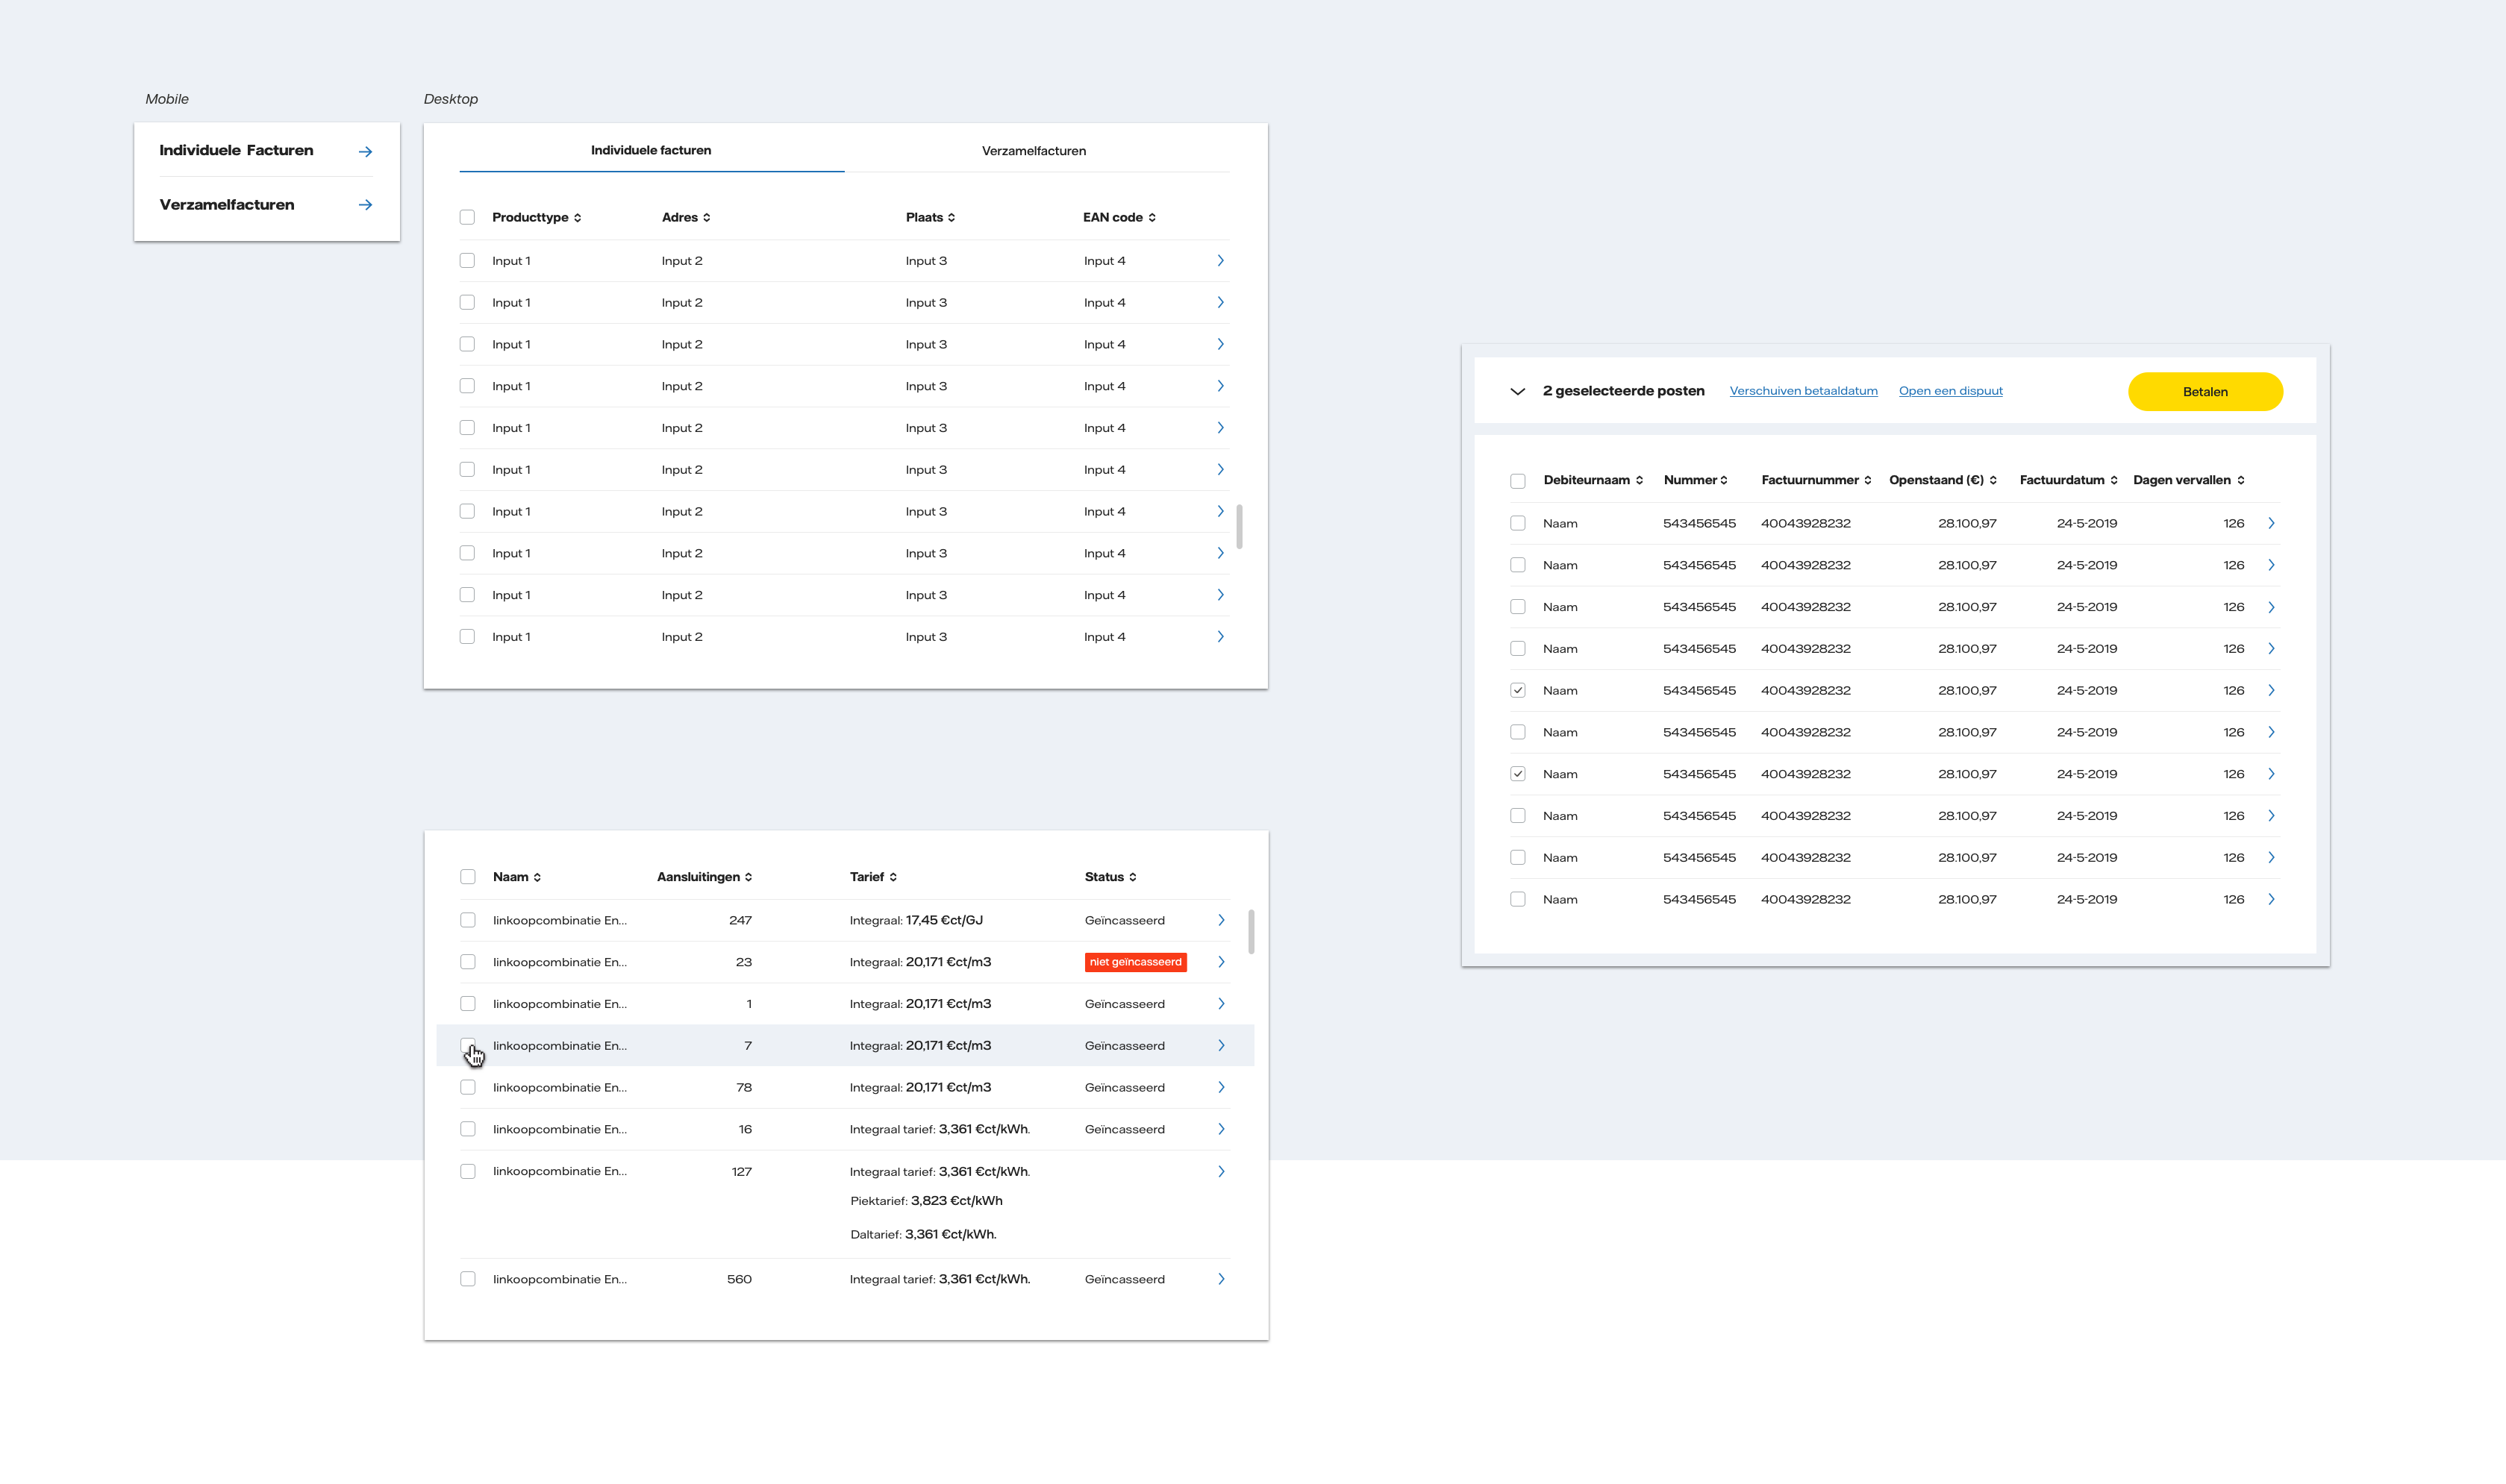
Analysing any valid data source I was able to get my hands on regarding the user story, the first step was to define the problem the new visualisations should solve, "what does the user need from this?" and "how will they work with it? Preferably achieving their goal in the least amount of time".
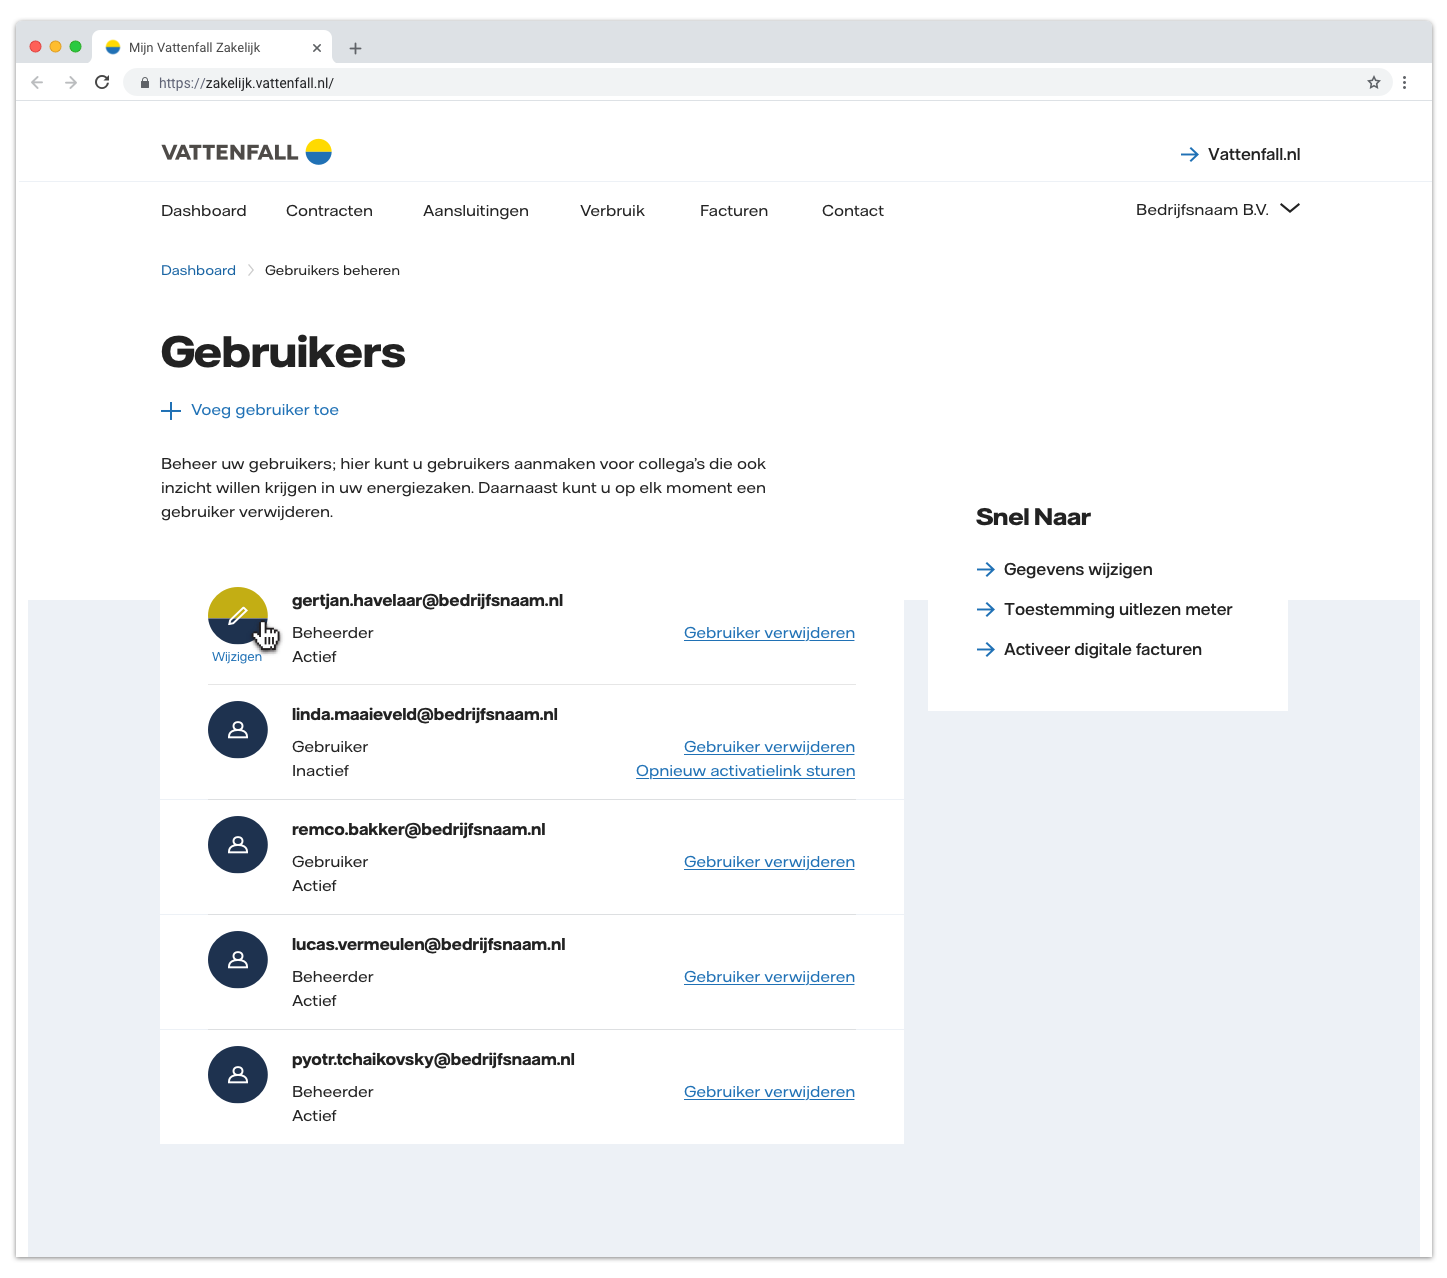
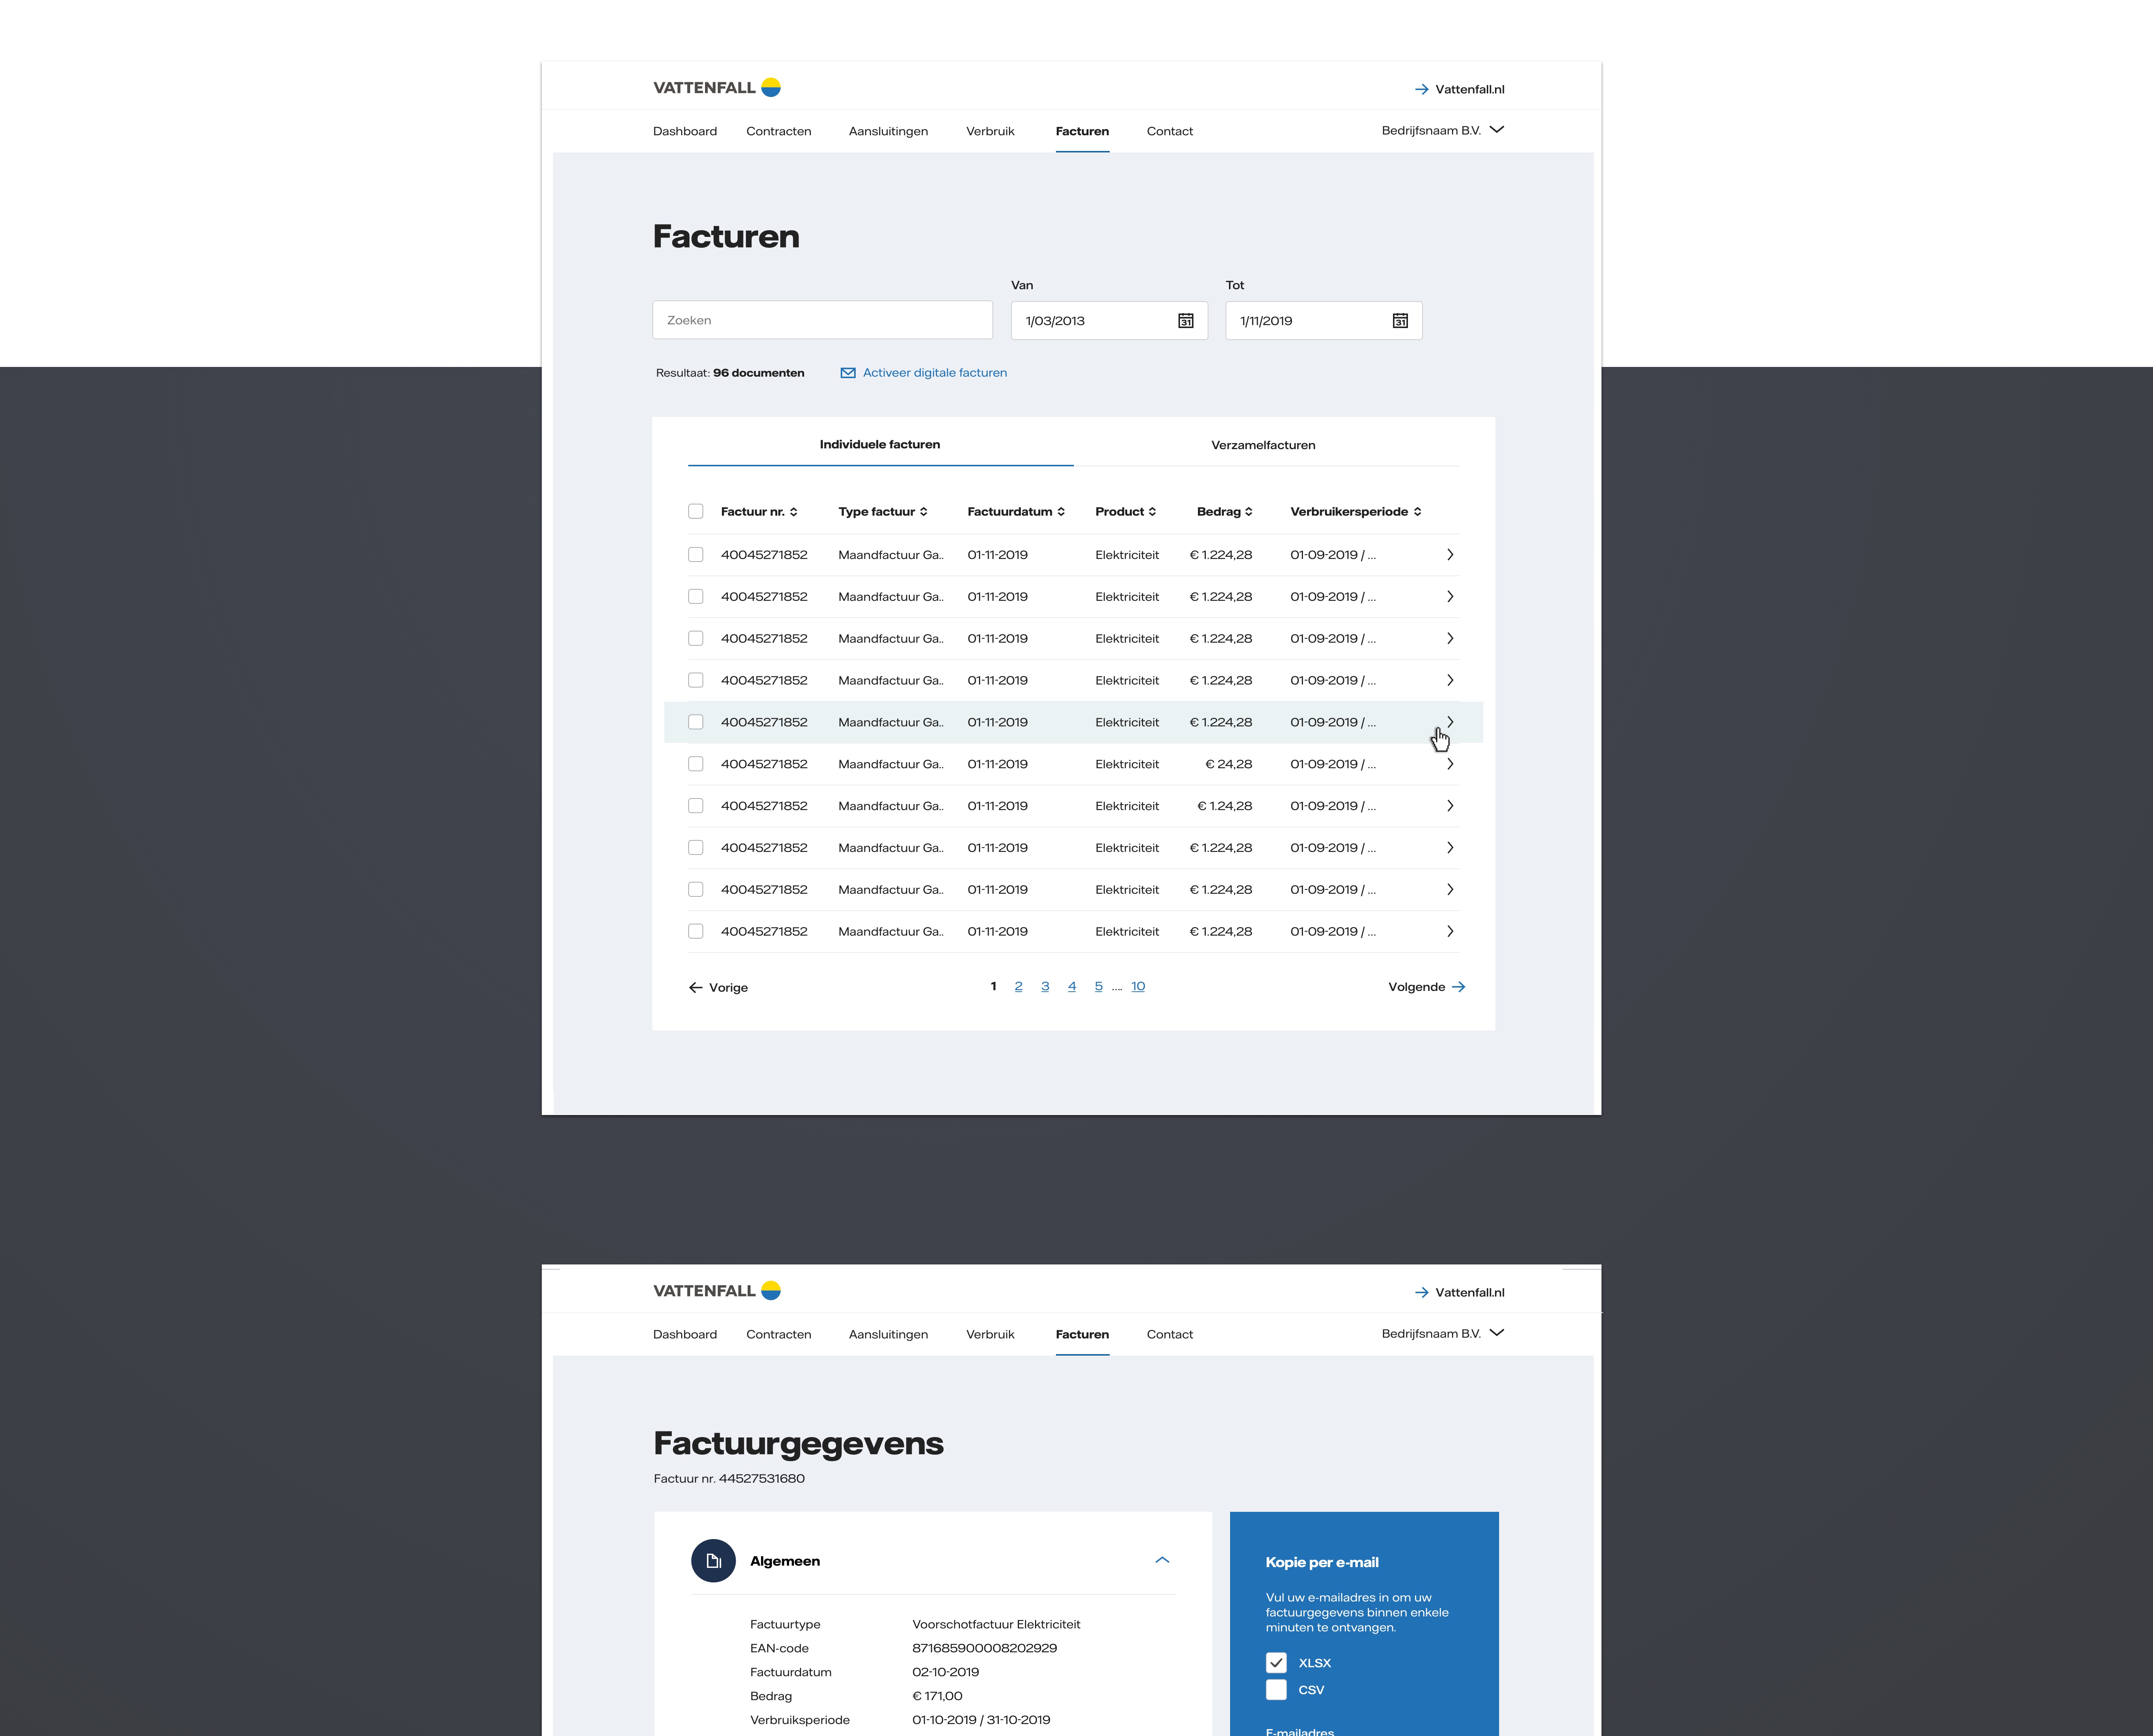
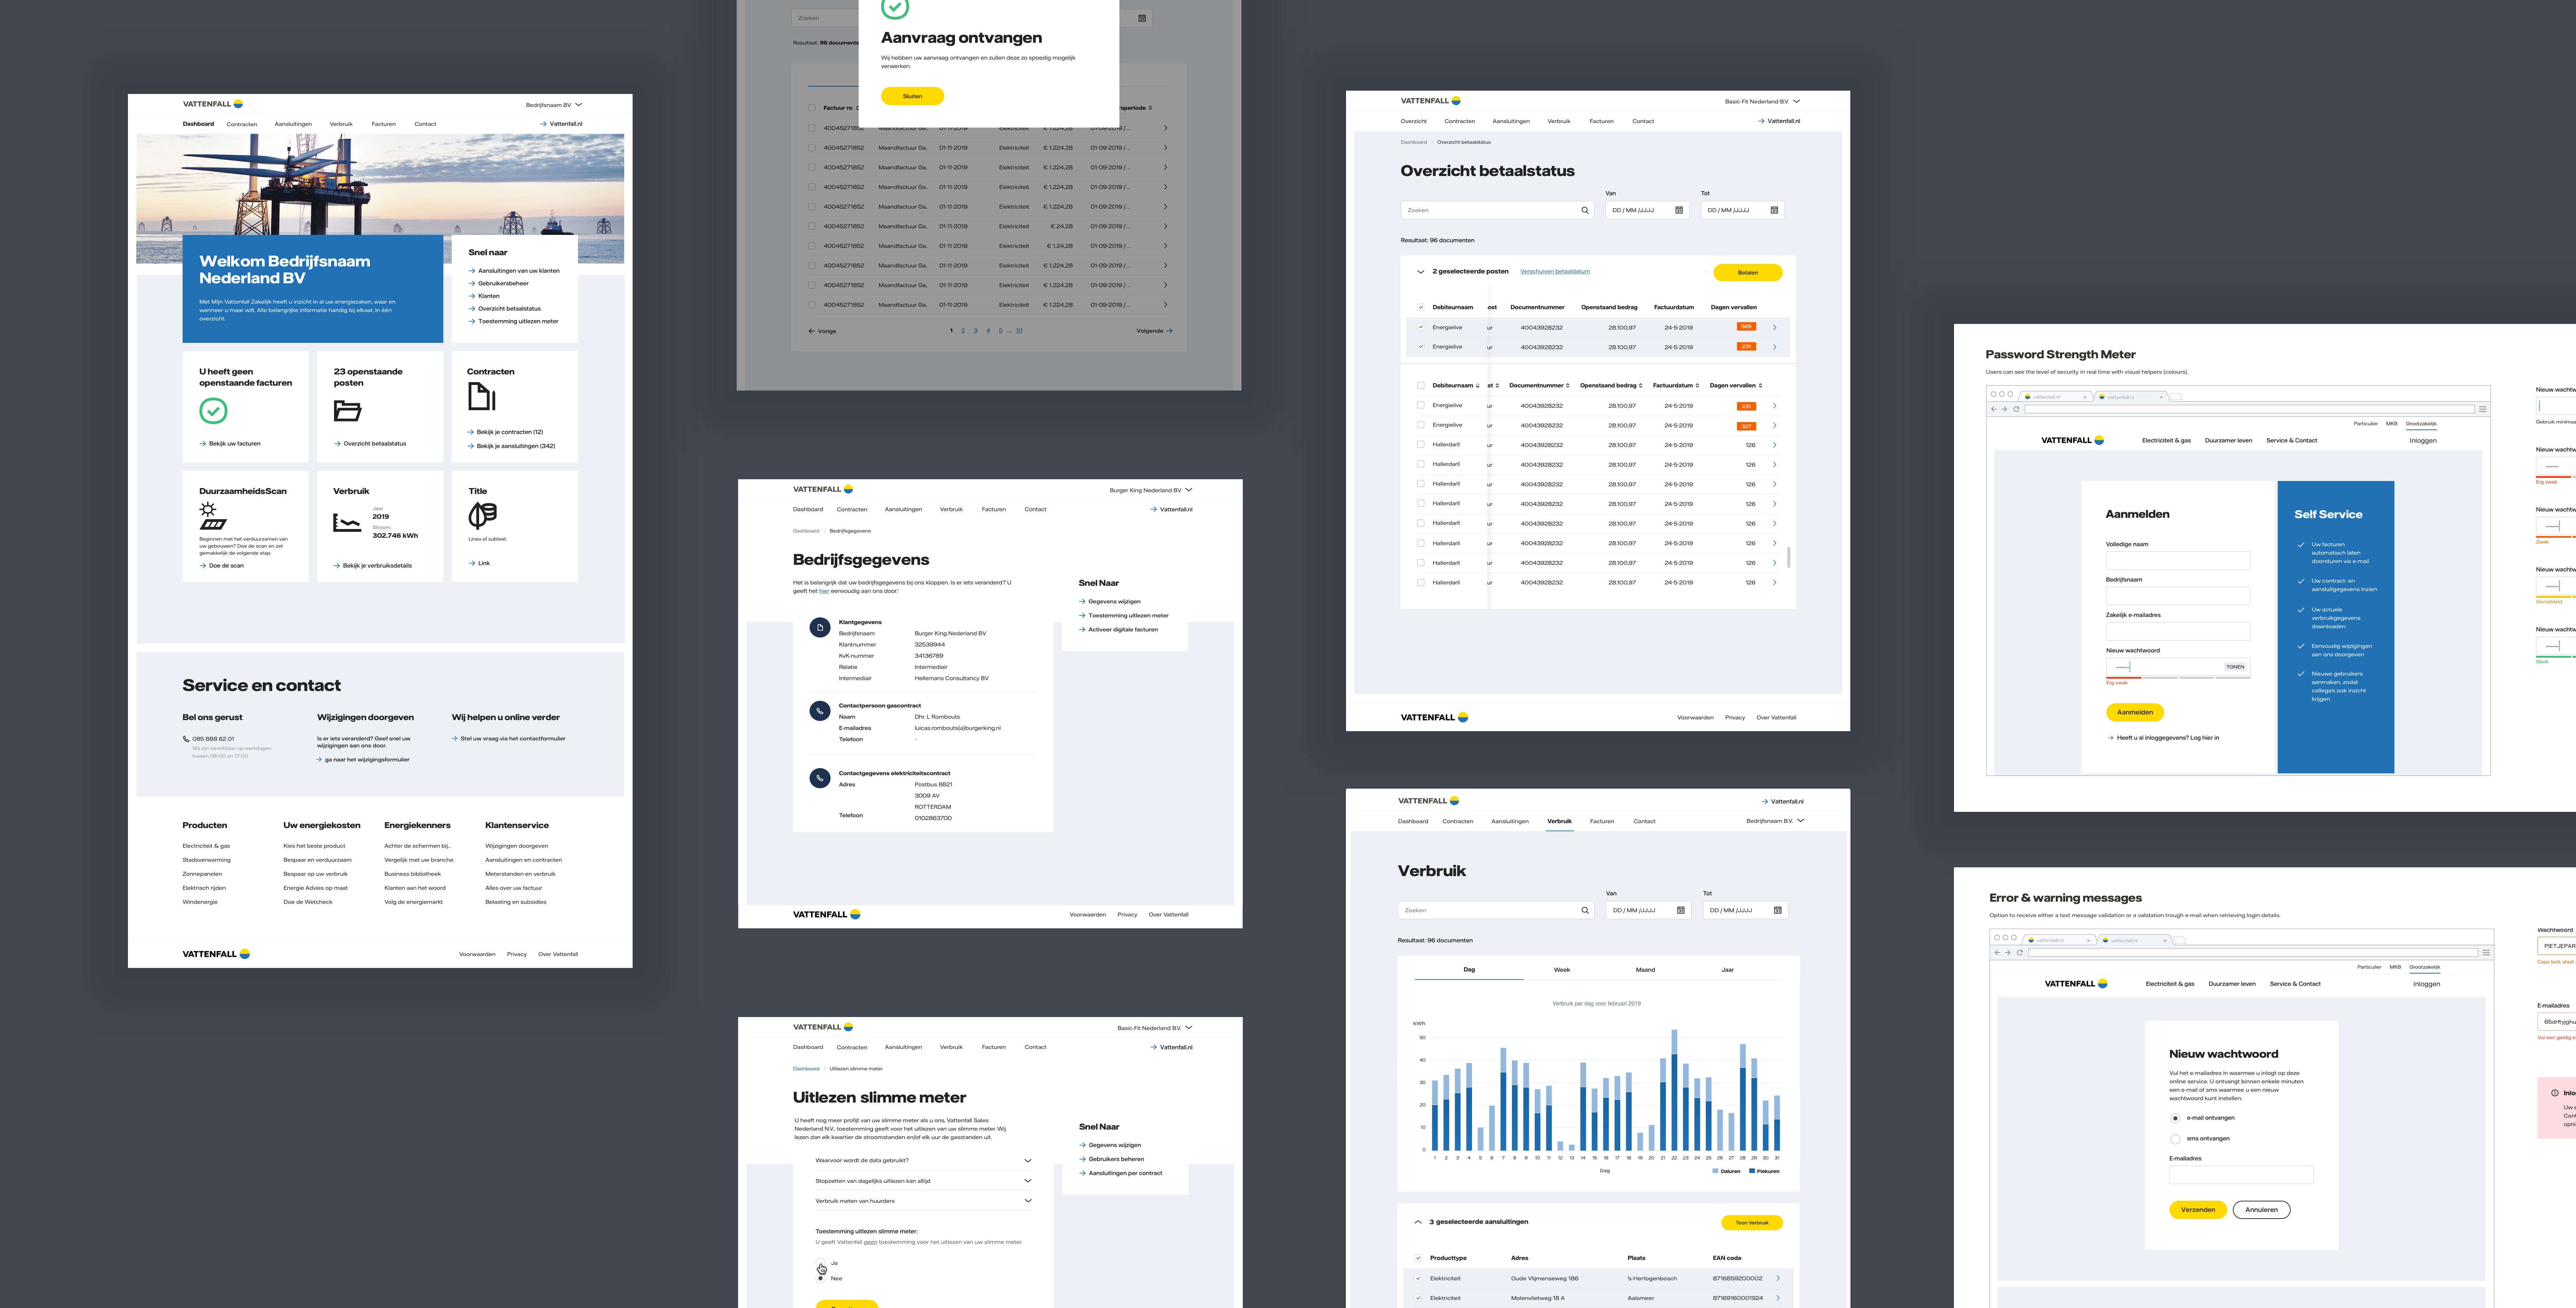
An online self-service
Providing customers with clear information on the use of their energy and enabling them to manage various energy matters online have resulted in fewer calls to the customer service department, leading to cost savings, process efficiencies, and an overall better service experience for both the users and employees.
Services
Data-driven and fact-based design
Service design
Date
2019
